

Before a factory cuts fabric, brands need more than a size chart—they need a realistic plan for how many units to make in each size. Good clothing size ratio planning helps reduce dead stock, avoid stockouts in core sizes, and make production orders easier to approve with confidence.
For brands developing a new line or refining an existing one, the first step is often to understand how the product will be sold, sampled, and replenished. If you are working through private label clothing manufacturing, the size curve should be treated as part of product development, not as a last-minute spreadsheet task.
Why size ratio planning matters before production
A size chart tells buyers the measurements of each size. A size ratio tells the factory how to allocate production across those sizes. That difference matters because a good chart can still lead to poor inventory if the ratio does not match real demand.
From a manufacturer’s perspective, the size curve affects cutting efficiency, sampling priorities, packing plans, and how much risk the buyer carries in slower sizes. If the wrong sizes are overproduced, sell-through slows. If the wrong core sizes are underproduced, the collection can appear to be out of stock even when the style is selling well.
For that reason, manufacturers usually think about the ratio together with product category, channel, and fit sensitivity. The answer is rarely a single universal split.
Size ratio, size curve, grading, and size chart are not the same thing

These terms are often used interchangeably, but they serve different roles in production planning.
- Size chart: the measurement reference for each size.
- Grading: the method used to scale a base pattern into other sizes.
- Size curve: the planned distribution of sizes across the order.
- Size ratio planning: the decision process used to build that distribution.
A brand can have accurate measurements and still choose the wrong ratio. That is why the planning step matters so much. If you need a deeper technical reference on how size changes are built, our article on pattern grading and size scaling explains why fit consistency depends on more than just measurement labels.
How sales channel changes the garment size ratio
Different channels create different demand patterns. A direct-to-consumer e-commerce brand may need a broader spread because customers browse and purchase across a wider range of sizes. Retail orders often lean more heavily on proven core sizes. Teamwear and uniforms may follow roster patterns, while corporate programs sometimes require a flatter curve if the buyer must serve a mixed employee base.
Channel also affects return risk. Online buyers are more likely to exchange sizes, so brands often protect their core sizes more carefully. In physical retail or wholesale, the ratio may be adjusted to match historical sell-through by store type, region, or customer segment.
E-commerce and marketplace brands
These brands usually need stronger core-size coverage, especially in the middle of the curve, because those sizes tend to turn fastest. If the assortment is new, conservative overproduction of extreme sizes can limit risk while the brand learns actual demand.
Teamwear, uniforms, and group programs
These orders are often less trend-driven and more distribution-driven. The ratio may need to reflect team rosters, employee demographics, or collected size forms rather than fashion market averages. In these programs, the buyer should confirm whether the final ratio is based on actual size submissions or estimated demand.
Product type changes the ideal size curve
Not every garment should be treated the same way. Men’s basics, women’s fitted styles, unisex styles, and performance garments all create different size behavior. For example, relaxed tees usually allow more flexibility, while close-fit leggings, bras, or tailored shirts need more careful planning.
Fit-sensitive products deserve extra attention because small errors in grading or ratio planning can create higher returns. If the style depends on precise construction, it helps to review a fit session checklist for better sizing before finalizing the order, especially for first-time development.
Men’s and unisex basics
These often support a stronger middle curve with moderate coverage at both ends. The shape of the demand curve is usually stable, but it still varies by market and channel.
Women’s fit-sensitive styles
Women’s products often need more caution because size perception can vary by silhouette, fabric stretch, and intended fit. A single ratio may not work across all styles in the same category.
Children’s and youth apparel
These ranges can cluster tightly around age brackets, but the buyer still needs to account for growth room, school requirements, and parent buying behavior.
How to build a better size curve using sales data and returns
The strongest ratios usually come from combining several inputs rather than relying on one source. Historical sales data shows what has sold. Returns show where sizing caused friction. Regional demand shows whether one market buys differently from another. Together, they create a more reliable picture than a generic industry ratio.
When reviewing performance data, brands should separate strong sell-through from strong returns. A size that sells well but is returned often may not be as healthy as it looks. In practice, the factory should see the buyer’s logic before the order is approved, which is why a pre-production checklist before bulk order is useful when the team is locking down quantities and measurements.
If you are using multiple sales regions, it may be smarter to build separate curves for each region instead of one blended order. That is especially true when body shape, climate, and channel mix differ between markets.
How to estimate a size curve with no past sales data
Many first-time brands do not have historical order data. In that case, the goal is not to guess perfectly—it is to reduce risk intelligently. Start with the fit target, target customer profile, and comparable products in the same category. Then use the sample results, market feedback, and MOQ constraints to build a practical starting ratio.
For new projects, manufacturers often recommend a conservative first run that protects the most likely core sizes while limiting exposure in sizes that are harder to predict. If the order size is small, a broader size set may still be possible, but the ratio needs to be realistic for the production plan. Our guide to low MOQ collection planning can help buyers think through those trade-offs before they commit.
In many first-time orders, the smartest move is to test one or two styles, learn how the market reacts, and then refine the curve on the repeat order.
Should small and plus sizes be reduced in volume?
Not automatically. Some brands reduce the outer sizes because they expect lower volume, but that decision should be based on actual demand and positioning, not habit. If the brand serves a broad body range or works in categories where inclusivity is part of the positioning, the lower and upper sizes may need stronger coverage.
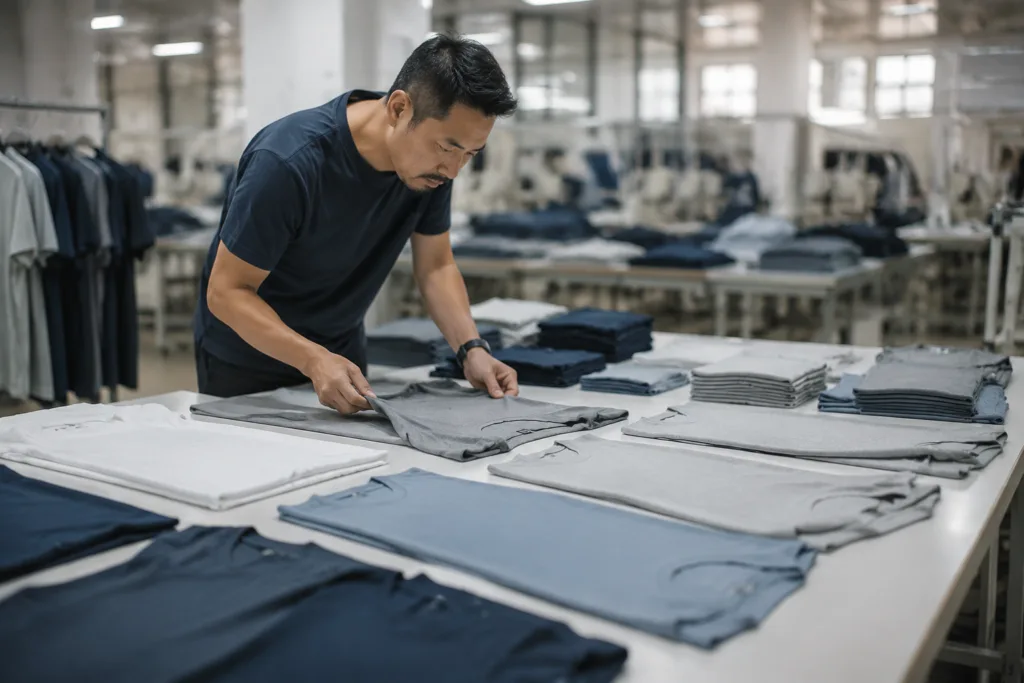
Small and plus sizes can also behave differently by channel. In e-commerce, customers may search specifically for those sizes and abandon the brand if they cannot find them. In retail, the store may sell through core sizes first, but that does not mean the extended sizes should disappear from the ratio altogether.
The right answer depends on sell-through history, target audience, and whether the collection is designed for broad distribution or narrow specialization.
How MOQ, fabric, fit, and positioning affect the final ratio
Manufacturing constraints matter. A ratio that looks ideal on paper may be difficult to execute if the MOQ is low, the fabric has shrinkage risk, or the style requires tighter fit control. Brands should think about the size curve as part of the larger production system, not as an isolated planning exercise.
When shrinkage or fit variability is involved, the curve may need a little more caution in the most size-sensitive areas. If the pattern has not been stabilized through sampling, the factory may advise more careful testing before locking the final breakdown. This is where planning and construction knowledge connect: better why pattern grading matters for fit consistency is not just a technical topic, but a direct input into how many units to produce in each size.
Brand positioning also plays a role. A premium tailored line may need a different curve than a relaxed promotional garment, even if both are sold to similar customers. The more specialized the fit, the more carefully the buyer should validate the ratio.
How to adjust the curve for repeat orders and replenishment
Once a style has sold, the ratio should become more data-driven. Repeat orders are usually the best time to refine the curve because the brand now has actual sell-through, return, and reorder information. Fast-moving SKUs may need stronger protection in the core sizes, while slow sizes can be reduced if the data supports that change.
Replenishment planning should also account for stock timing. If the core sizes sell out too early, the product can lose momentum even if inventory remains in slower sizes. That is why the factory and buyer should review the previous shipment together before reordering rather than copying the first ratio blindly.
Common mistakes brands make when planning garment size ratios
Many ratio mistakes happen because teams focus on the sample fit and ignore the order mix. A perfect sample does not guarantee a good production curve. The most common issues include over-relying on intuition, using a generic ratio that does not fit the channel, ignoring returns, and failing to adjust for fabric behavior.
Another common mistake is approving the final size breakdown before confirming the production steps. A strong pre-production review helps the buyer catch issues before cutting begins. That is why a jump sizing versus full size set sampling discussion can be useful when teams are deciding how much development work is needed before bulk production.
When the buyer rushes the size ratio, the factory may be forced to produce according to a weak assumption rather than a real business plan.
A practical pre-production size breakdown example
For a unisex T-shirt order, a brand might start with a center-heavy curve if the target market is broad and the product is a core repeat item. The exact numbers will vary, but the logic may look something like this:
| Size | Purpose in the curve | Planning note |
|---|---|---|
| XS | Low-volume support size | Keep limited unless demand proves otherwise |
| S | Secondary core size | Useful for broader coverage |
| M | Core size | Often one of the strongest sellers |
| L | Core size | Often matched closely to M |
| XL | Secondary core size | Can stay close to L depending on market |
| 2XL | Extension size | Adjust carefully based on audience |
This is not a fixed formula. The actual ratio should follow channel demand, sample feedback, and order size. For buyers working on a product launch, the important part is to submit a curve that the factory can actually produce without confusion. At Ninghow Apparel, this is often the point where the team confirms quantities alongside fit samples, size specs, and packing requirements so production can move cleanly.
If you need a broader production reference before final approval, the why pattern grading matters for fit consistency article can help connect measurement decisions to the final size mix.
What buyers should confirm before approving the final size curve
Before sending the order to production, buyers should confirm the target customer, channel, fit goal, approved measurements, sample feedback, MOQ constraints, and any fabric behavior that could affect size perception. If the collection will be reordered later, the initial curve should also leave room for learning.
It also helps to verify whether the supplier is planning the order from a sampling perspective or simply from a spreadsheet. A reliable factory should be able to explain why the chosen ratio makes sense, how the sizes were graded, and what could change after final testing. For buyers who want a more structured production review, the garment sampling stages from proto to TOP article is a useful companion to the size curve discussion.
Conclusion

Clothing size ratio planning is one of the most important decisions made before production begins. It affects sell-through, inventory risk, production efficiency, and how well the final order matches real customer demand. The best ratio is not always the most common one—it is the one that fits the product, the channel, the buyer’s data, and the factory’s production realities.
When the size curve is built carefully, the buyer reduces avoidable risk and gives the manufacturer a clearer path to a successful run. That is especially important for first-time orders, where every unit needs to support both sales and learning.
FAQ
What is clothing size ratio planning?
It is the process of deciding how many units to produce in each size before the order goes into bulk production. The goal is to match expected demand, reduce inventory risk, and support better sell-through.
How is a size ratio different from a size chart?
A size chart shows measurements, while a size ratio shows quantity distribution across sizes. A product can have a correct size chart but still be overproduced in the wrong sizes if the ratio is poorly planned.
What if my brand has no past sales data?
Start with target customer assumptions, comparable products, fit feedback from samples, and MOQ limits. Then use a conservative first curve and refine it after the first sell-through cycle.
Should I always make the middle sizes the largest part of the curve?
Often yes, but not always. The ideal curve depends on your channel, product type, and customer profile, so the strongest sizes should be based on evidence rather than habit.
Do small and plus sizes need special planning?
Yes, because they can sell differently by channel and market. If your brand serves those customers consistently, they should be planned deliberately instead of being reduced automatically.
When should I change the size curve for a repeat order?
Change it when sales, returns, or replenishment data show a different demand pattern from the first order. Repeat orders are the best time to improve the curve using real performance results.